Interactive Collection View tutorial
A short walkthrough of several features of the Interactive Collection View.
Last updated
A short walkthrough of several features of the Interactive Collection View.
Last updated
Once you are signed in, you can follow this tutorial using a collection of your own.
Navigate to the Collections page using either menu (Hamburger or banner). Select a collection.
When you create a Collection, the tree is not created automatically. If it is possible to create a tree, a "generate tree" button will be shown.
Scroll through the Metadata Table at the bottom to get an idea of the genome data.
Select some data rows, and notice that the Map Panel and Tree panel highlight the location for that genome. Use the Table menu to “Hide unselected entries.” This applies in each table separately.
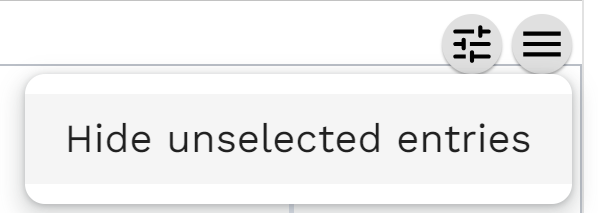
Change column width by dragging the sides of a column header or by using the column’s filter icon and the “expand column” icon.
Hover on a column header: A filter icon appears, and can be used to open the column's filtering menu.
In the column's filtering menu, Click "Sort" options to order the rows based on the values in the column. Note that these may be alpha-sorted, not numerically.
Open "Filter by values" and select some options, then "APPLY FILTER" - all panels are filtered. Clear the filter.
Filtering by condition allows you to set number- or text-based specifications (depending on the column type), including the use of regular expressions for text columns.
Genomes (rows) with values that are not selected or do not meet conditions will be filtered out from all panels, until/unless the filter is cleared.
Click on the the highlighted marker, and notice that a number of rows get selected (all the genomes from that location, not just the one you originally selected in the table), and those genomes are highlighted in the tree too.
Clear all filters by clicking the filter icon at the right of the "Search in all columns" search & filter bar (top center). "reset all filters."
In the Metadata Table, click on the filter icon for a column to see how many values it contains: This will affect how many colour palettes are available for that column.
Select "No. contigs" as the Colour Column, and select "Gradient" in the Colour Palette option. Click on the colour band.
Change Colour Column to "Name"
Open the Tree Panel Menu and click "Metadata Blocks"
Add "No. Contigs" and the other columns you set palettes for. Note that the resulting Metadata Blocks are coloured with the palettes you selected.
Open the Legend using the right side panel.
Opening (or creating) a Collection brings up the , displaying all genomes in the Collection in multiple panels.
: a core distance-based neighbour-joining tree, viewed using PhyloCanvas (top left)
: shows all genomes in the collection that have a location associated with them (top right).
, & (bottom)
Adjust row height using “Density"
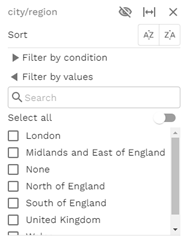
Choose which data columns to show/hide on the active table using the filter icon "Columns" lozenge and tickboxes (or the "Search" and "Select all" options to quickly select subsets of columns)
Show/hide an individual column by using the show/hide icon that appeared.
Now click on the Settings icon in the , and notice that zoom icons appeared in the bottom right corner. Zoom in (using your mouse wheel or the zoom icons) until the map only shows two or three markers, including the highlighted one.
Select the "" icon in the Map menu and notice that all genomes not currently shown on the map are hidden from all panels. The highlighted genomes remain highlighted until you click on a blank area of the Map or Tree. Select the Viewport icon again to clear that filter.
Select the , which is layered behind the . Click on a bar and it highlights in other panels. Adjust the "Unit" lozenge and "Type." Filter the date range by dragging the "Timeline Overview" (bottom timeline) rightmost bar. This also affects other Panels.
Open the settings menu 
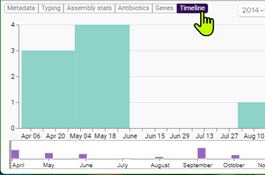
and select different tree styles.
Click on the eye icon in the upper right corner of the dashboard. Click on "." Start typing your column name until it shows, then select it. Click on "Colour Palette" and set "Number of Colours" to be greater than the values in your column. Select a pallette. Notice that the tree colours change accordingly.
Select a new column as the Colour Column, and toggle "Custom Palette." Click on the colour box and choose specific colours. CLICK "CONFIRM" in the bottom right before closing the palette windows! (you may need to click in the white space first, see #4)
Choose the "Genes" or "Antibiotics" table. 
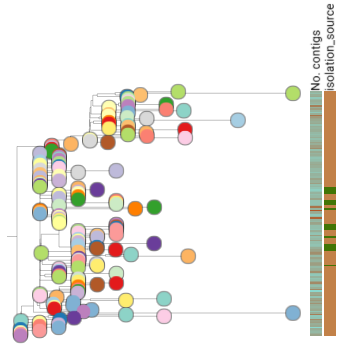
Click on a column header, and notice that the tree leaves, map markers, and legend change with this quick column-header method of setting the Colour Column.